

An 18-year health gap: How where you live shapes your chances in Britain
An 18-year health gap: How where you live shapes your chances in Britain
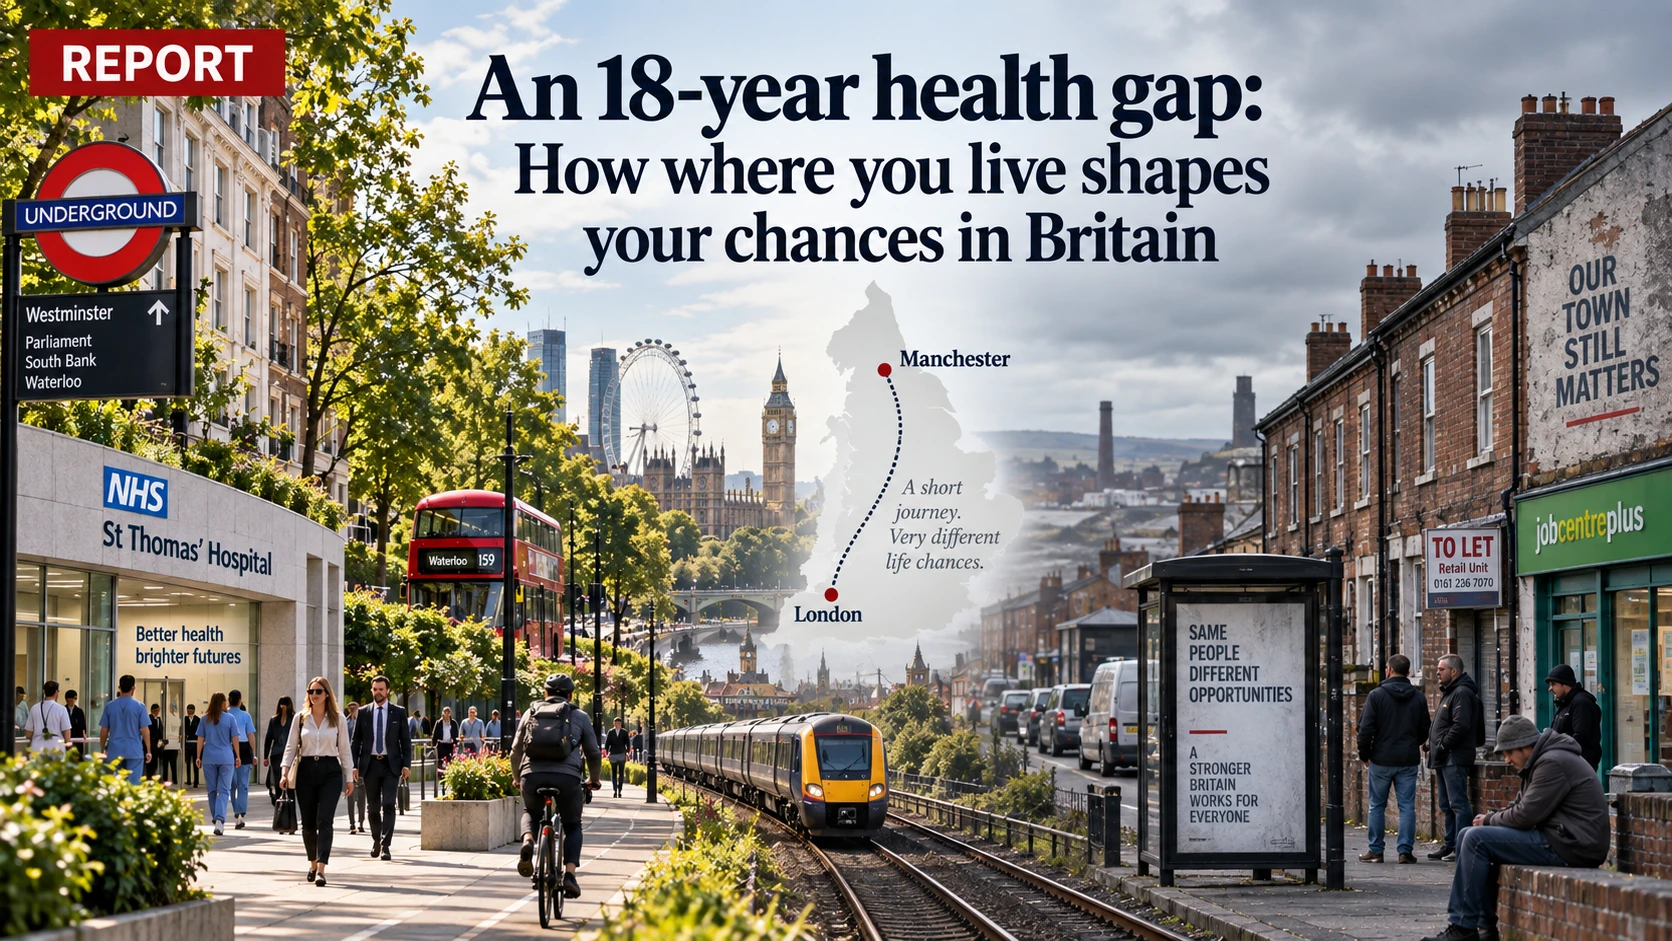
A short train journey can separate two parts of England. But the difference between life in them can be measured not in miles, but in years.
In Richmond upon Thames, a man can expect to live 69.3 years in good health. In Blackpool, the figure is just 50.9 years — a gap of more than 18 years, according to the latest data from the Office for National Statistics. Among women, the divide is similarly stark: 70.3 healthy years in Richmond, compared with 51.8 in Blackpool.
Britain has long been familiar with the idea of the postcode lottery: that access to a service can depend on where you happen to live.
But put the maps of health, income, employment, housing and access to nature alongside one another, and the question becomes bigger. How much of a person’s chances in life are shaped by where they live?
An 18-year divide in healthy life
The ONS figures for 2022–24 show many of the areas with the highest healthy life expectancy clustered in London and the South East.
At the other end are places including Blackpool, Hartlepool and Sandwell. In Hartlepool, healthy life expectancy stands at 52.1 years for men and 51.2 for women. In Sandwell, the figures are 52.7 and 51.3 respectively.
And the inequality does not end with the likelihood of becoming ill.
Lord Darzi’s investigation into the NHS found that people in England’s most deprived communities were twice as likely to wait more than a year for non-urgent treatment as those in the least deprived areas.
A&E attendance was almost twice as high, while emergency hospital admissions were 68 per cent higher.
Darzi described the pattern as a return to the “inverse care law”: those who need healthcare most can face the greatest difficulty accessing it.
NHS England now publishes waiting-list data broken down by deprivation, geography and healthcare provider, allowing disparities that disappear inside national averages to become more visible.

The postcode lottery, in other words, can begin before a patient reaches hospital. Where someone lives is associated both with how many years they are likely to spend in good health and, once they need treatment, how easily they may be able to get it.
Employment has a geography too
Move from the hospital to the labour market and geographical disparities appear again — although the picture becomes more complicated.
A recent study by the Institute for Fiscal Studies found that the share of 18 to 24-year-olds receiving health- or unemployment-related benefits had risen to 10.9 per cent.
Official figures also show the proportion of young people not in education, employment or training rising from 10.8 per cent in 2022 to 12.8 per cent by the end of 2025.
But the deterioration has not happened evenly across the country.
The proportion of young people recorded as being in paid employment fell by at least three percentage points in eight of the 12 UK regions and nations examined by the IFS, with London recording a four-point decline.
In northern England, Wales and Scotland, a larger share of the increase in benefit claims was associated with health-related inactivity. In London, unemployment accounted for more of the rise.
Local figures reveal even sharper contrasts, although the latest detailed ONS analysis relies on 2021 Census data. In Blackpool, 22.2 per cent of young men and 20.4 per cent of young women were not in education, employment or training. The comparable figures fell to 6.1 per cent for young men in Bath and North East Somerset and 4.6 per cent for young women in York.
Yet the ONS analysis also contains an important warning against an overly simple postcode explanation. Much of the geographical difference narrowed once researchers accounted for the characteristics of the people living in each area.
Place matters. But place is not destiny independent of the people who live there.
The income gap is wider still
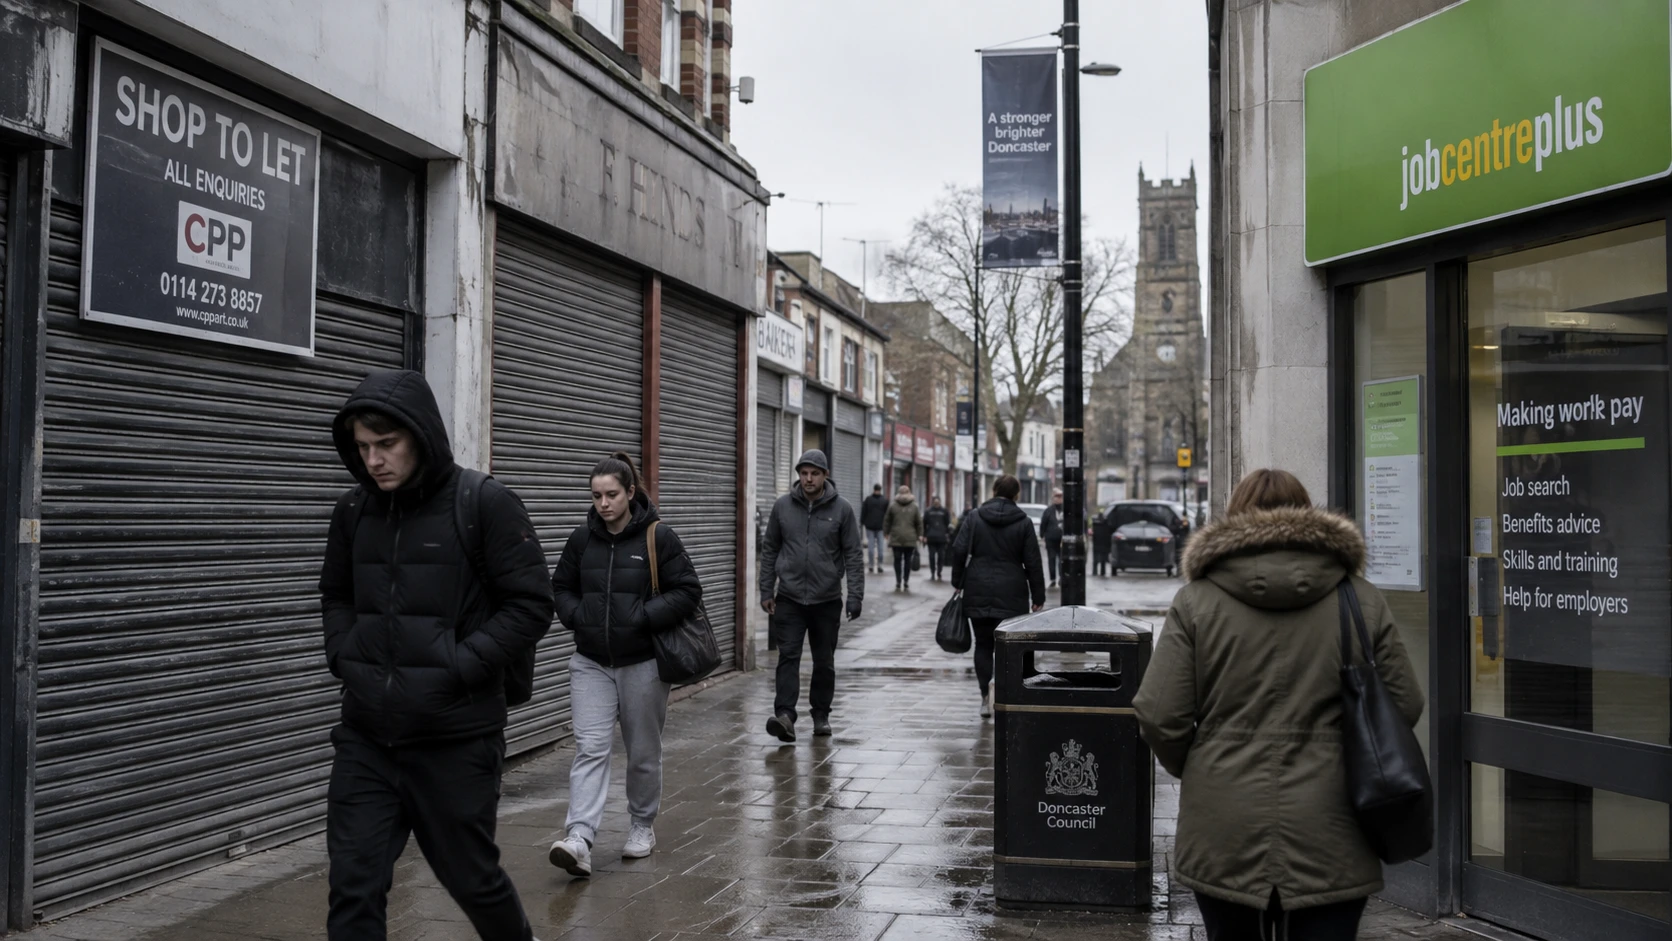
The economic divide between different parts of Britain is substantial.
The latest ONS figures show gross disposable household income per person — broadly, the income available for spending or saving after redistribution — at £36,487 in London in 2024, compared with £20,562 in the North East.
At a local level, the gap becomes much wider.
Westminster and the City of London recorded £84,292 per person, more than three times the UK average. Leicester stood at just £16,786. All five areas with the lowest disposable income per person were in the Midlands or northern England.
But this is where Britain’s geography begins to resist the familiar story of a prosperous South and a struggling North.
High average income does not protect an area from other forms of hardship.
London provides perhaps the clearest example.
London: wealthy, but under extraordinary housing pressure
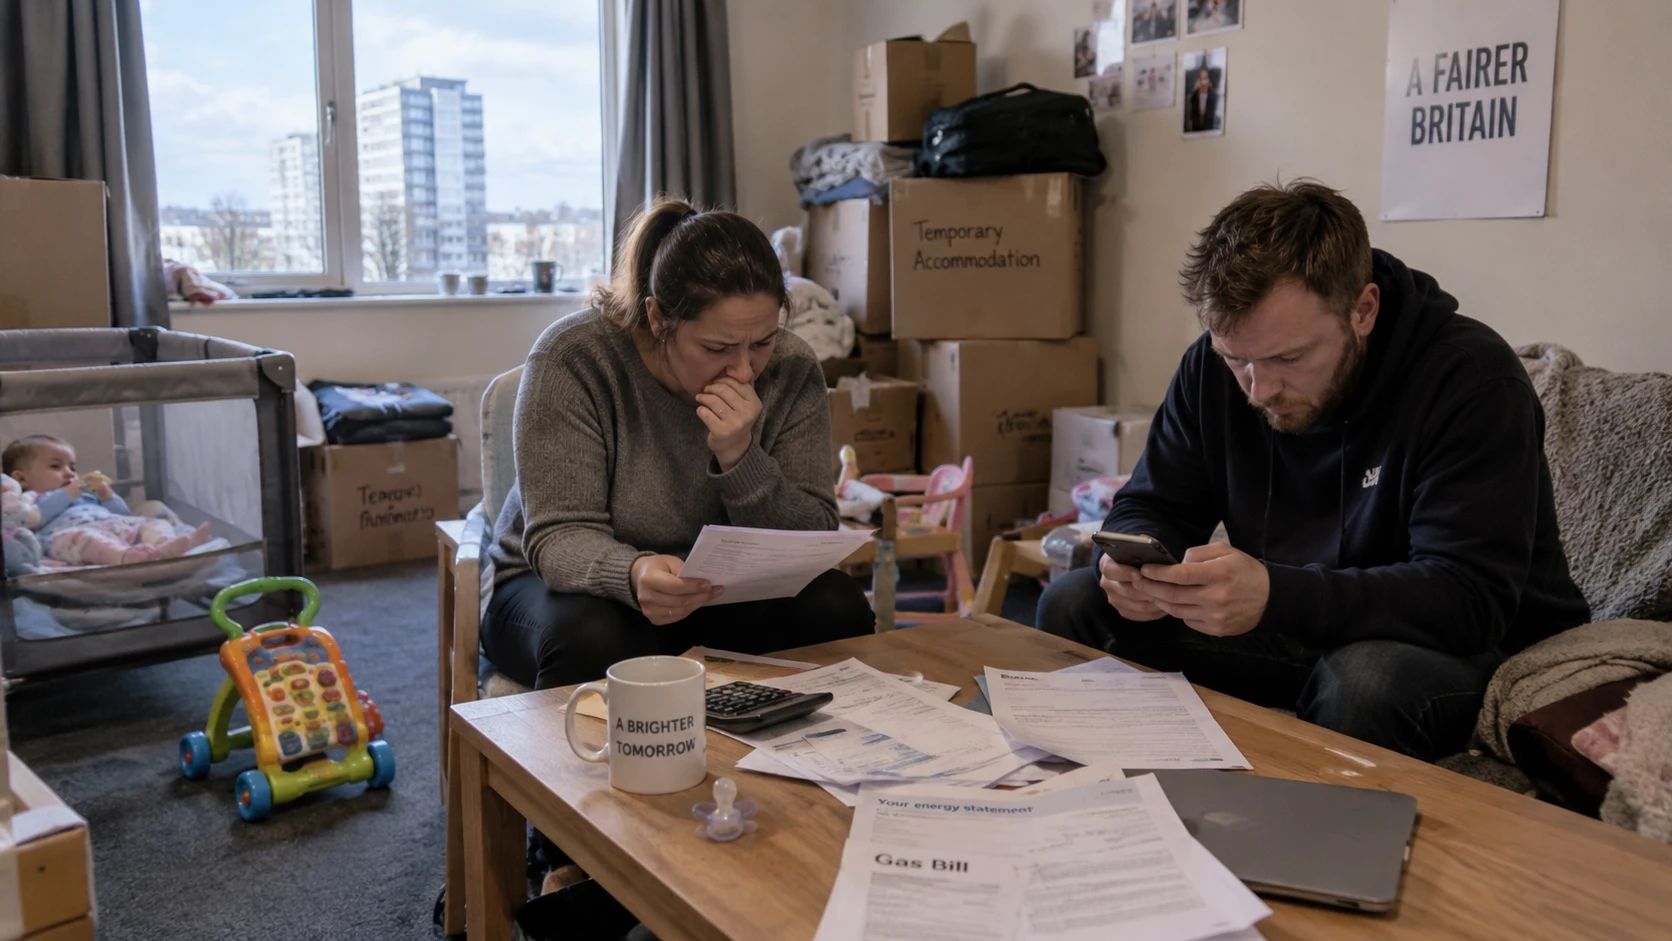
At the end of March 2026, 135,580 households in England were living in temporary accommodation — the highest number on record. They included 86,460 households with children, with 177,530 children living in temporary accommodation.
Nationally, there were 5.5 households in temporary accommodation for every 1,000 households.
In London, the rate was 21.1 per 1,000.
The local disparities were more dramatic still: 59.8 per 1,000 households in Newham, 48.6 in Westminster and 32.8 in Hackney. Outside London, Brighton and Hove recorded 16.2, Hastings 15.1 and Crawley 13.1, according to the latest official homelessness statistics.
The two maps almost collide in Westminster.
It sits within the part of the country recording the highest disposable income per person, yet also has one of England’s highest rates of households living in temporary accommodation.
That contradiction matters. Britain cannot be neatly divided into a wealthy South and a deprived North. Extreme wealth and severe housing pressure can exist within the same city — sometimes within the same borough.
And temporary accommodation is not simply a housing statistic.
Government guidance published this month warns that repeated moves can disrupt children’s healthcare, access to specialist services and NHS appointments. Damp, mould, cold, overcrowding and housing instability can themselves damage health.
The inequalities therefore begin to reinforce one another: housing can become a health problem; poor health can affect employment; and income, in turn, shapes the housing choices available.
Even access to nature has a postcode
There is another inequality that rarely appears in household budgets: what lies outside the front door.
Research published by the Wildlife Trusts on 17 September found that 238 English constituencies — 44 per cent of the total — contain neighbourhoods where at least one in five households live more than a 15-minute walk from accessible green or blue space, such as parks, rivers, canals or lakes.
Seven of the ten most economically deprived constituencies also appeared among areas with poor access to nature, including Bradford West and Birmingham Perry Barr.
The issue has taken on greater significance after this summer’s heatwaves. Trees, parks and water do more than provide somewhere pleasant to spend an afternoon; they can also offer cooler spaces when urban temperatures climb.
The government itself now measures access to green and blue space against the ambition that people should be able to reach it within a 15-minute walk from home.
The presence of a nearby park, then, becomes another part of Britain’s geographical inequality rather than merely an amenity.
There is no single postcode lottery
It would be tempting to put all these figures on a map, draw a line across England and declare that there are two Britains: a prosperous South and a left-behind North.
The evidence is messier than that.
London has the highest disposable income per person of any UK region, yet faces exceptional pressure from temporary accommodation. Youth employment has deteriorated in London as well as in parts of northern England. And some apparent geographical differences in youth inactivity shrink substantially once the characteristics of local populations are taken into account.
What emerges instead is a series of overlapping inequalities that combine differently from place to place.
In one area, the central problem may be employment. Somewhere else, it is housing. Elsewhere, healthcare or access to green space. In some communities, several disadvantages accumulate at once, making it harder to escape any one of them.
That raises a problem with the phrase postcode lottery itself.
A lottery suggests chance. Yet the patterns in health, income, housing and access to services are not simply random differences between neighbouring postcodes. They reflect years of accumulated disparities in wealth, housing, investment, infrastructure and public services.
When a man in one part of England can expect more than 18 additional years of healthy life than a man elsewhere, the question is no longer simply where do you live?
It is how much of your life chances does where you live determine?
ShortURL ⬇